 by
by 
TABLE OF CONTENTS
Ever wondered how to check and monitor GPU temperature? You’ve come to the right place!
Today, I’ll be breaking down how to do exactly that, what you’ll need, and provide a variety of GPU temperature-related tips so that you walk away with a decent foundation before you start monitoring your temps.
But let’s not get ahead of ourselves, and instead, dive right into exactly what you need to check your Graphic Card’s temperature.
What You Need To Check GPU Temperature, and Why It Matters So Much
Fortunately, to just do a quick check of your GPU temperature, you don’t really need anything.
The functionality is built into Windows 10 and Windows 11, and I’ll show you how to get to it in the “How to Check” section down below.
However, if you’re hoping to monitor your GPU temperatures in real-time (especially while playing a game or during a heavy rendering session, for example), you’ll need to get a hardware monitor.
I’ll break down my recommended hardware monitor and how to use it in the “How To Monitor” section.
If this feels a little like extra work, don’t be discouraged!
Being able to accurately monitor your GPU temperature and gauge when there’s a problem will go a long way toward helping improve the longevity and stability of your GPU and the rest of your PC.
If you aren’t sure what temperature range is safe for your graphics card, we have an extended guide you can peek at, but I can give you an idea right here before we proceed.
For most graphics cards, the range of temperatures where you need to start worrying will be in the range of 90 degrees Celsius and above.
The exact tolerance will depend on your GPU, though, and even some modern designs are rated to run at up to 110 degrees Celsius before throttling!
How to Check and Monitor GPU Temperature
So, how do you quickly check your GPU temperature within Windows?
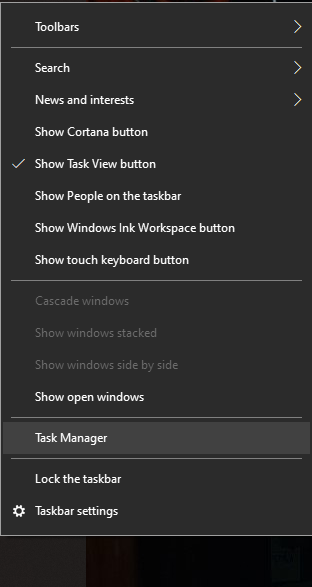
Pretty simple, actually. Just right-click your taskbar and open Task Manager:
Within Task Manager, navigate to the “Performance” tab and locate your GPU performance monitor.
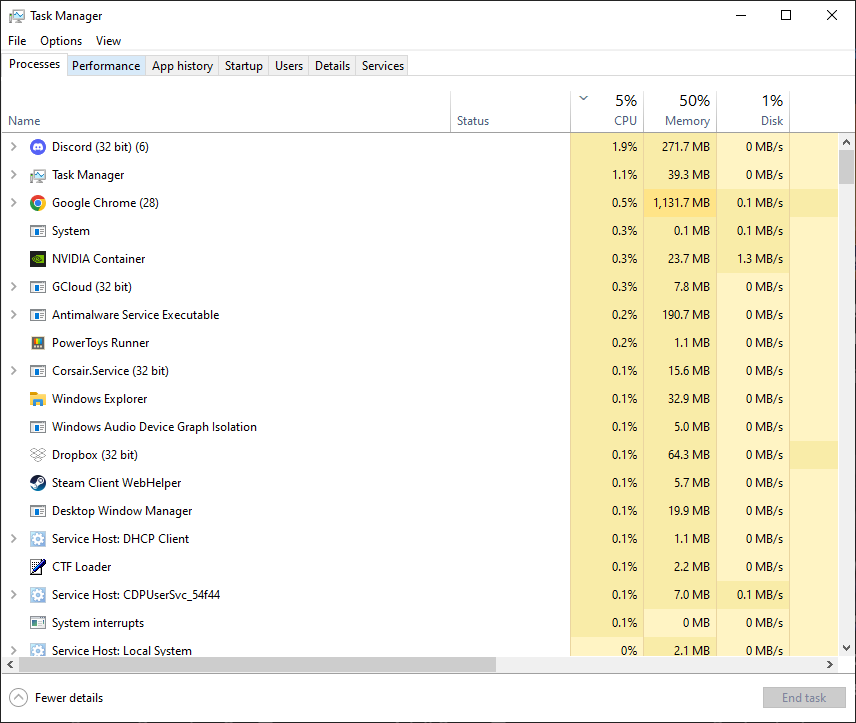
Within this space, you should be able to see real-time GPU usage and temperature readings.
You’ll even be able to see a chart monitoring your recent GPU usage-over-time. However, you will only be able to check your current GPU temperature in Task Manager.
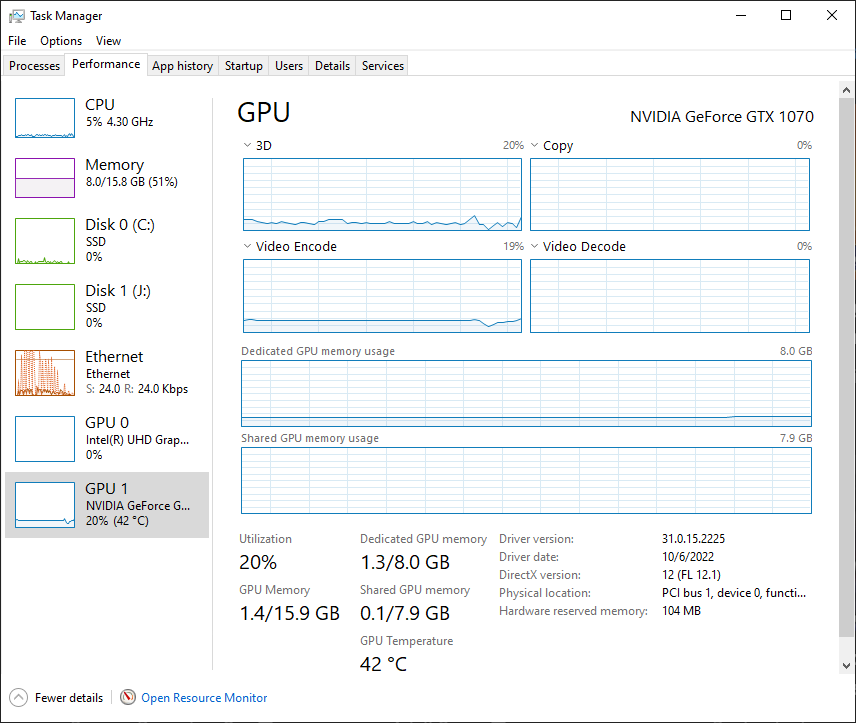
For more advanced features, like temperature logging-over-time or real-time monitoring in other applications, you’ll need a hardware monitor.
Move on to the next section and I’ll help you get set up with this!
How To Monitor GPU Temperatures In-Game and Over Time
Well, it looks like you will need MSI Afterburner and RivaTuner Statistics Server.
Download and install both of those applications in one go here, before proceeding.
If you aren’t interested in overclocking, don’t worry! You do not need to use MSI Afterburner to overclock your GPU. Also, don’t worry if your GPU isn’t from MSI. The MSI Afterburner works with non-MSI GPUs as well.
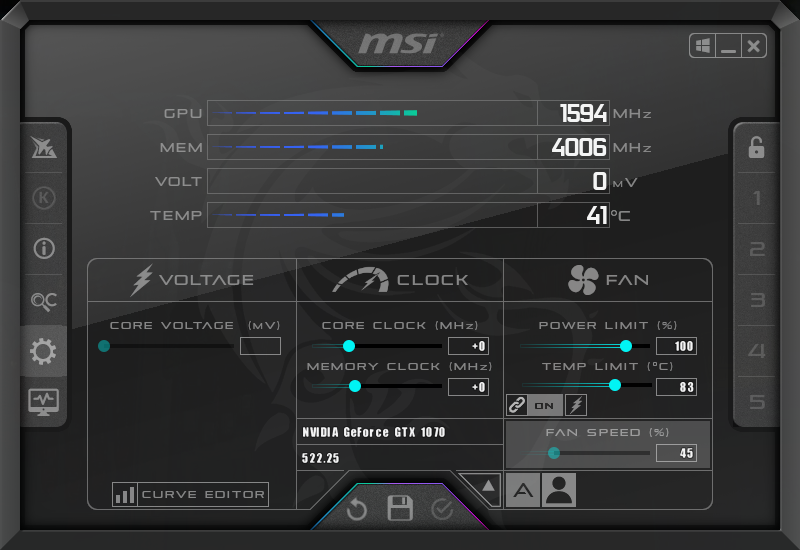
In the context of this article, we’re going to be using MSI Afterburner as a GPU temperature hardware monitor.
The companion RivaTuner Statistics Server will be used to overlay and display this real-time hardware monitor. So, how do you get all of that set up?
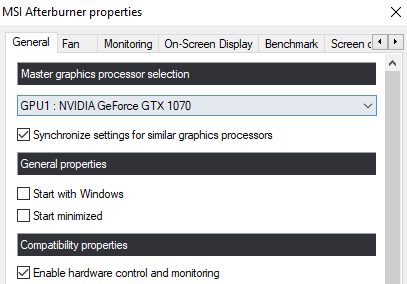
First, open MSI Afterburner and click the Settings button to open up your Afterburner settings.
Make sure “Enable hardware control and monitoring” is checked under “Compatibility properties”.
Now, click the “Monitoring” tab and make sure the settings shown in the below screenshot are enabled with Properties showing as “in OSD”. (OSD = On-Screen-Display)
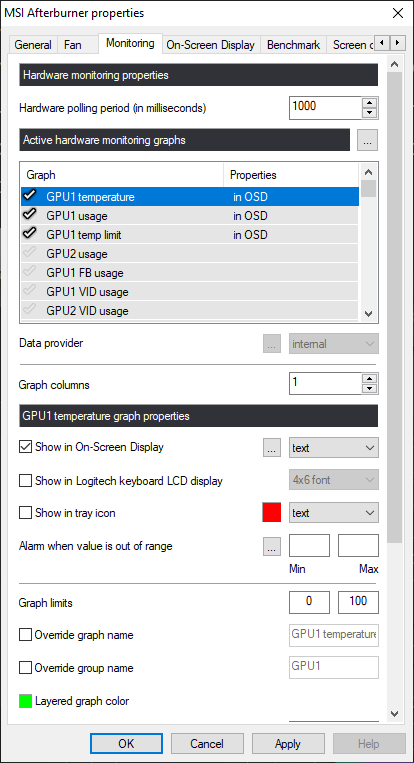
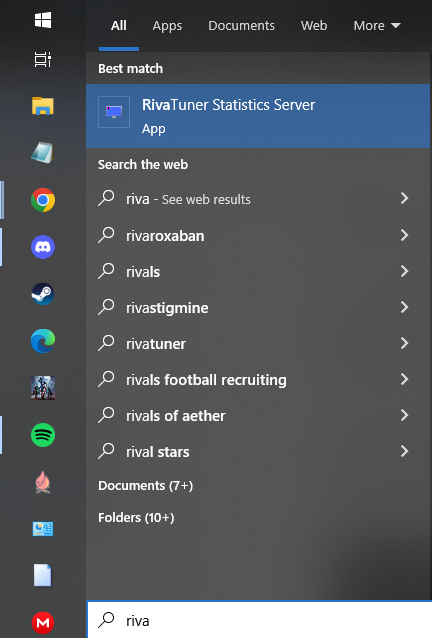
Click “Apply” and “OK”. You can minimize Afterburner, but don’t close it. Now, open up RivaTuner Statistics Server.
In RivaTuner Statistics Server, you’ll always have a “Global” profile, but for the sake of this article, I’m going to use my Team Fortress 2-specific (hl2.exe) profile.
The settings to make sure you have enabled for RivaTuner’s overlay are “Show On-Screen Display”, “On-Screen Display support”, and “Show own statistics”.
Depending on your screen resolution and the number of statistics you’ll be showing from MSI Afterburner, you may want to also adjust the OSD Zoom slider.
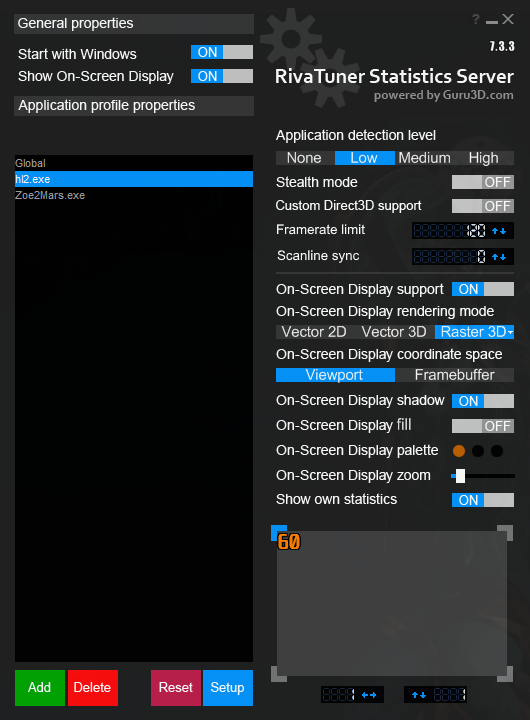
You may also notice that I have an FPS cap, or framerate limit, in there for Team Fortress 2. These serve to stabilize input latency and power consumption, especially on powerful hardware.
That side note aside, let’s go ahead and see how our settings look in-game!
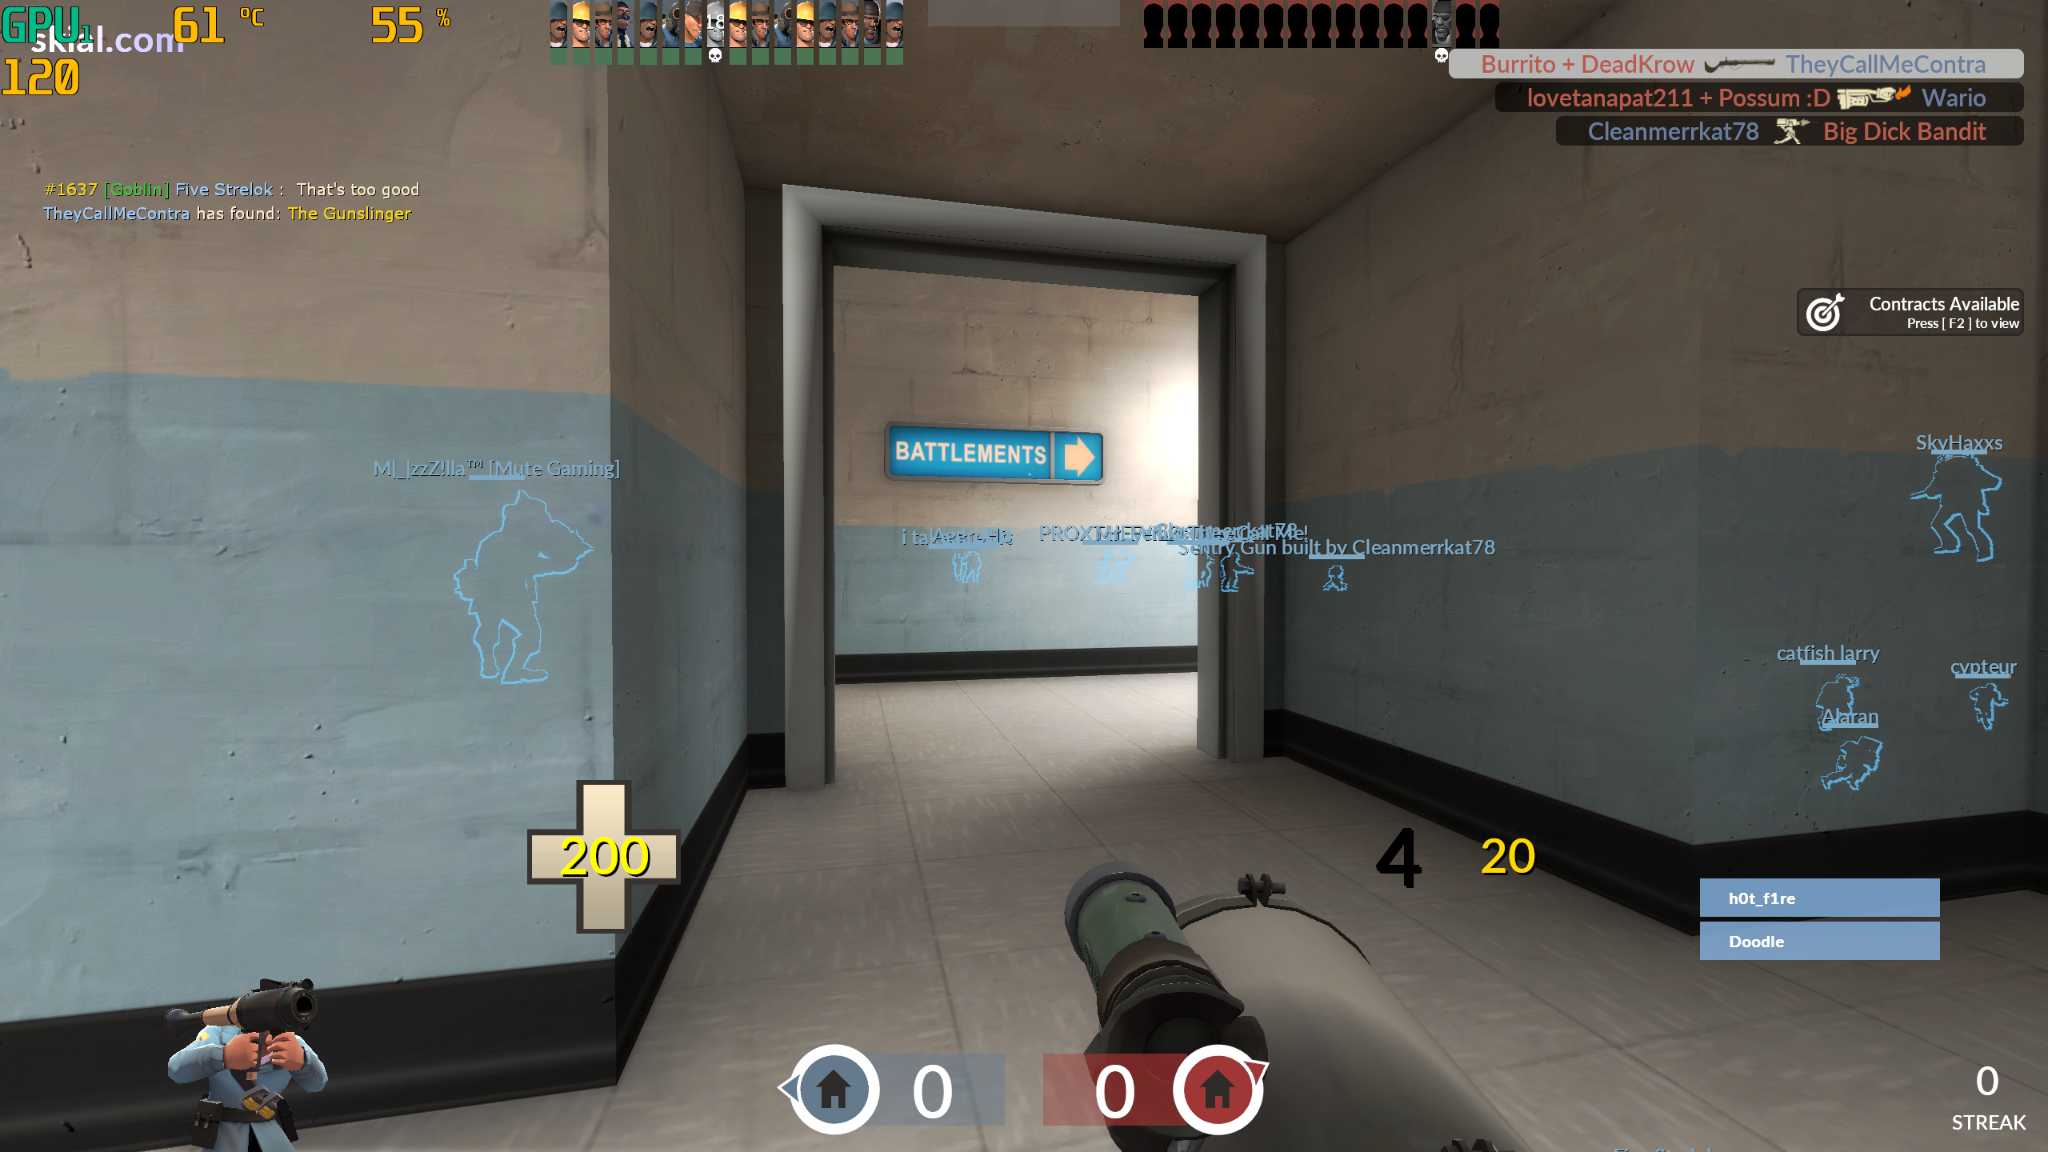
In the top-left corner, you can see that Team Fortress 2 stabilizes at roughly 50-60% GPU usage for me, and under 65 degrees Celsius, while running at 120 FPS.
TF2 is a more CPU-demanding game than a GPU-demanding game due to its age, so for this game, I would actually consider enabling the other real-time metrics for CPU usage and temperature that we saw earlier in Afterburner…but I thought I would stay on task for this guide.
How To Monitor GPU Temperatures in Desktop/Windowed Applications Over Time [The Easy Way]
Although there’s no more exhaustive way to monitor your GPU Temperature than MSI Afterburner in conjunction with RivaTuner Statistics Server, it may seem too complex to set up properly.
Also, you might not be using a full-screen application and won’t need an OSD that displays your temps at all times.
Especially for monitoring your GPU temperature and other interesting specs like VRAM usage in Desktop/Windowed Applications, I’ve found the GPU-Z sensors to be an extremely easy way to tackle this.
Download the newest version of GPU-Z here. GPU-Z is a portable Application that needs no installation.
After launching it, go over to the “Sensors” tab, and that’s it!
You’re presented with all kinds of information about the utilization of your GPU(s), and the current “GPU temperature” that is handily displayed over time is just one of the many things you can monitor.
Quick Tips To Improve High GPU Temperatures
Have high GPU temps and want some quick tips on reducing them? This is where I would start:
- Enforce an FPS Cap (recommended) or V-Sync — I highly recommend capping your FPS in general, not just to improve temperatures. Stable capped FPS provides a smooth-and-steady image and reduces input lag variability.
Barring an FPS cap, V-Sync also helps but can introduce some performance issues. Either setting will help reduce your GPU power usage and temperatures by not forcing your GPU to run at full-throttle constantly in games that support going over 60 FPS. - Disable Overclocking or “Boost” Modes — If you’re installed your manufacturer’s GPU software and enabled a Boost mode or your GPU is overclocked, returning to stock settings should help stabilize temperatures.
I recommend taking step #1 first, though, and continuing down this list if that doesn’t help you. - Lower Graphics Settings — This one feels like a bit of a no-brainer but is definitely still worth noting. Higher graphical fidelity requires more power, which generates more heat from your GPU.
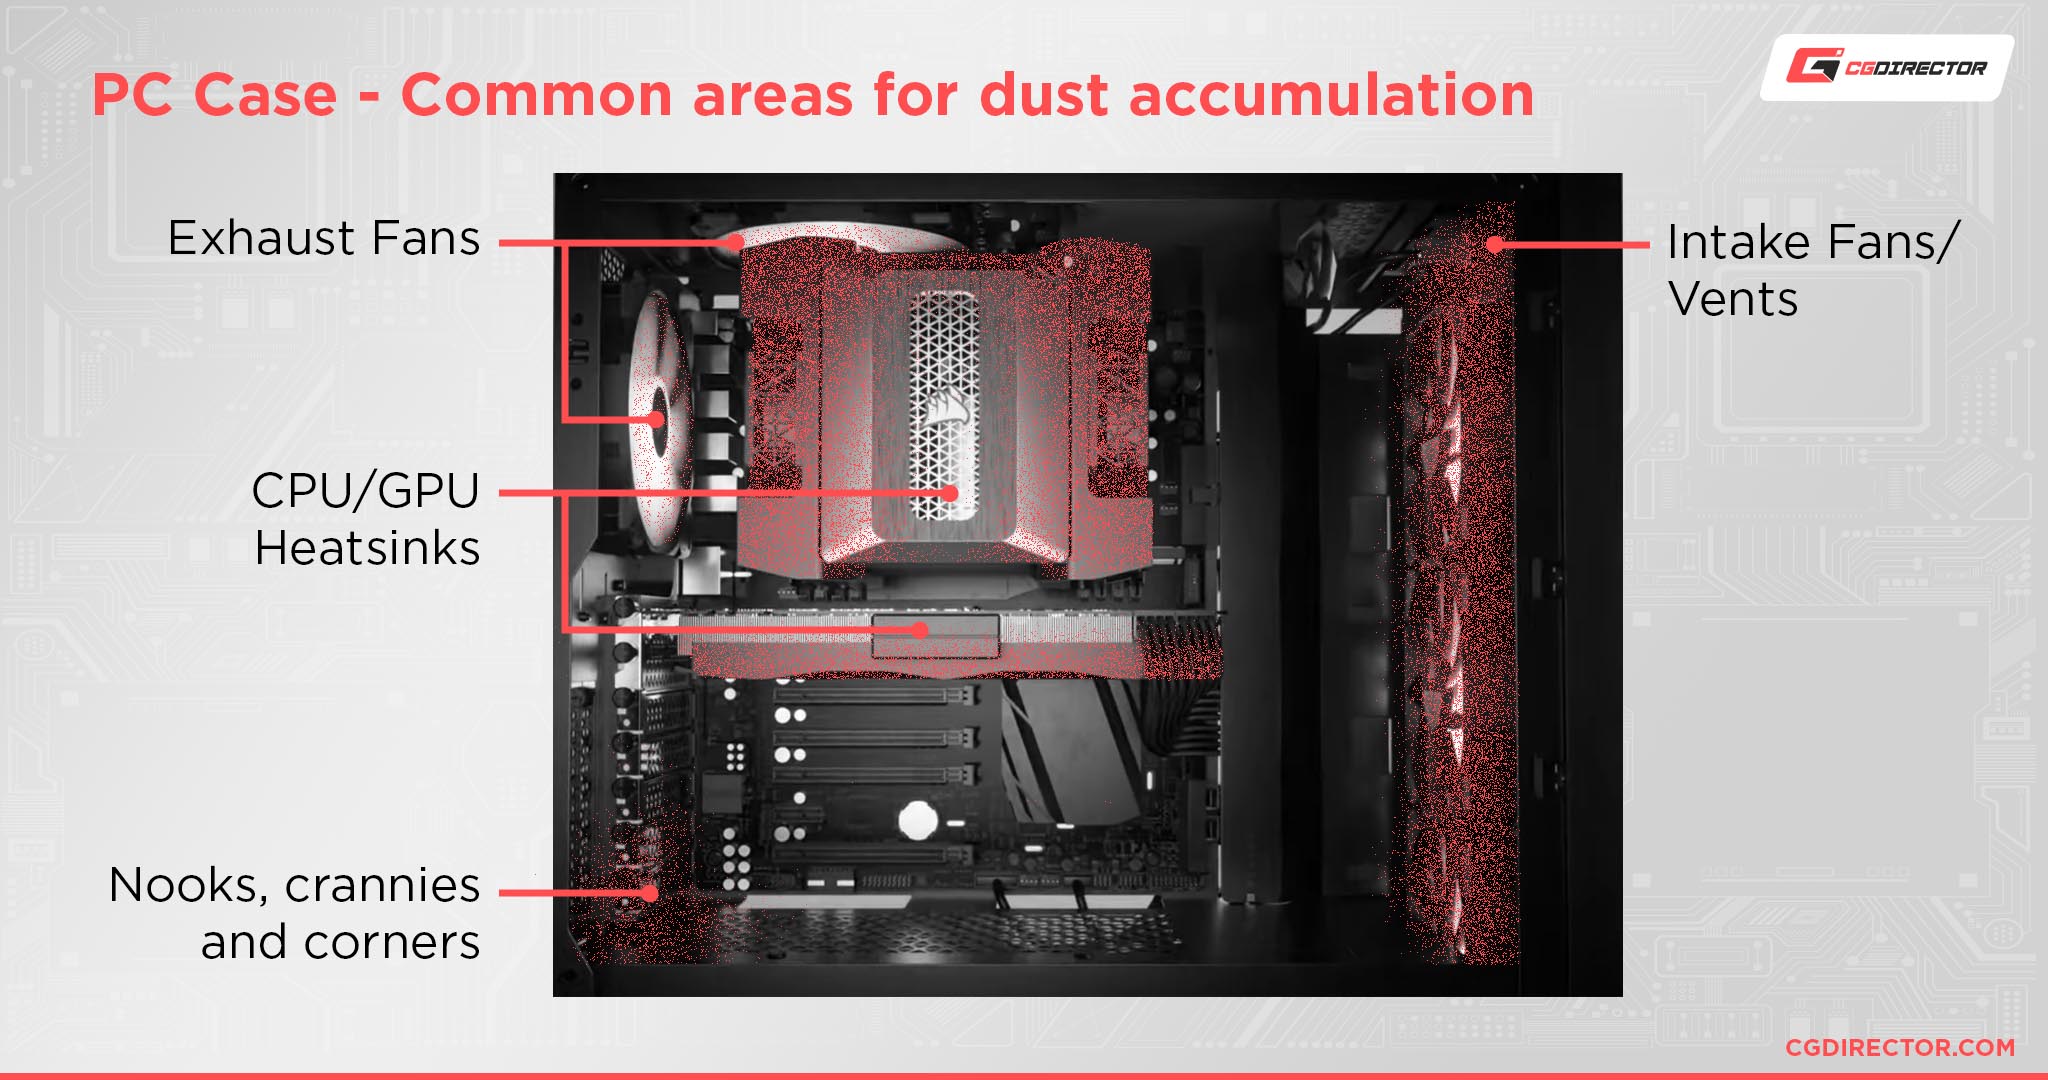
Lowering settings, especially in tandem with an FPS cap or V-Sync, will meaningfully reduce GPU load and temperatures. - Improve Case Cooling — Your GPU doesn’t exist in an isolated bubble: the rest of your PC can have an impact on its performance and thermals, too.
I would definitely make sure that your case has a positive pressure airflow configuration (minimum 2 intakes and 1 exhaust fan, and always making sure there is more intake than exhaust) if taking the other steps is still not helping your GPU temperatures. - Clean Your PC and GPU — Finally, if you’ve done all four of the above and are still dealing with too-high GPU temperatures, it’s probably time for a deeper cleaning.
If you haven’t owned your GPU for more than three years, you shouldn’t need to worry about replacing thermal paste yet.
For more tips on reducing GPU temperatures in more detail, head over to my full guide on How To Lower GPU Temperature.
FAQ
What Is a Good GPU Temperature For General Use?
If you’re just messing around on your desktop or watching some videos, your GPU shouldn’t be under particularly heavy load or high temperatures.
If it is, that’s a likely sign that there’s a deeper problem with your GPU and its cooling that needs fixing.
So, what temperature range should you expect your GPU to hover at while not under heavy utilization? I would say that the best range for light GPU use is at or under 50 degrees Celsius.
What Is a Good GPU Temperature For Gaming?
If you’re gaming, your GPU temperature is definitely going to rise.
If you’re pushing your GPU to its limits, it might even start knocking on your temperature limit— but pushing your GPU limits isn’t actually a good thing for gaming! Allow me to explain.
Basically, if your GPU is running at or above 95% GPU utilization in a game, you will suffer increased input lag as a result.
This is another reason why FPS capping and V-Sync are such favored options. Even if higher FPS reduces input lag, full GPU utilization introduces performance inconsistencies and input lag spikes that stable utilization under 95% does not.
So, ideally, your GPU temperature while gaming will still be under maximum utilization.
Depending on the thermal headroom of your GPU, I’d try to make sure that your GPU temperature isn’t exceeding 85-95 degrees Celsius while in-game!
What is a Good GPU Temperature For Rendering?
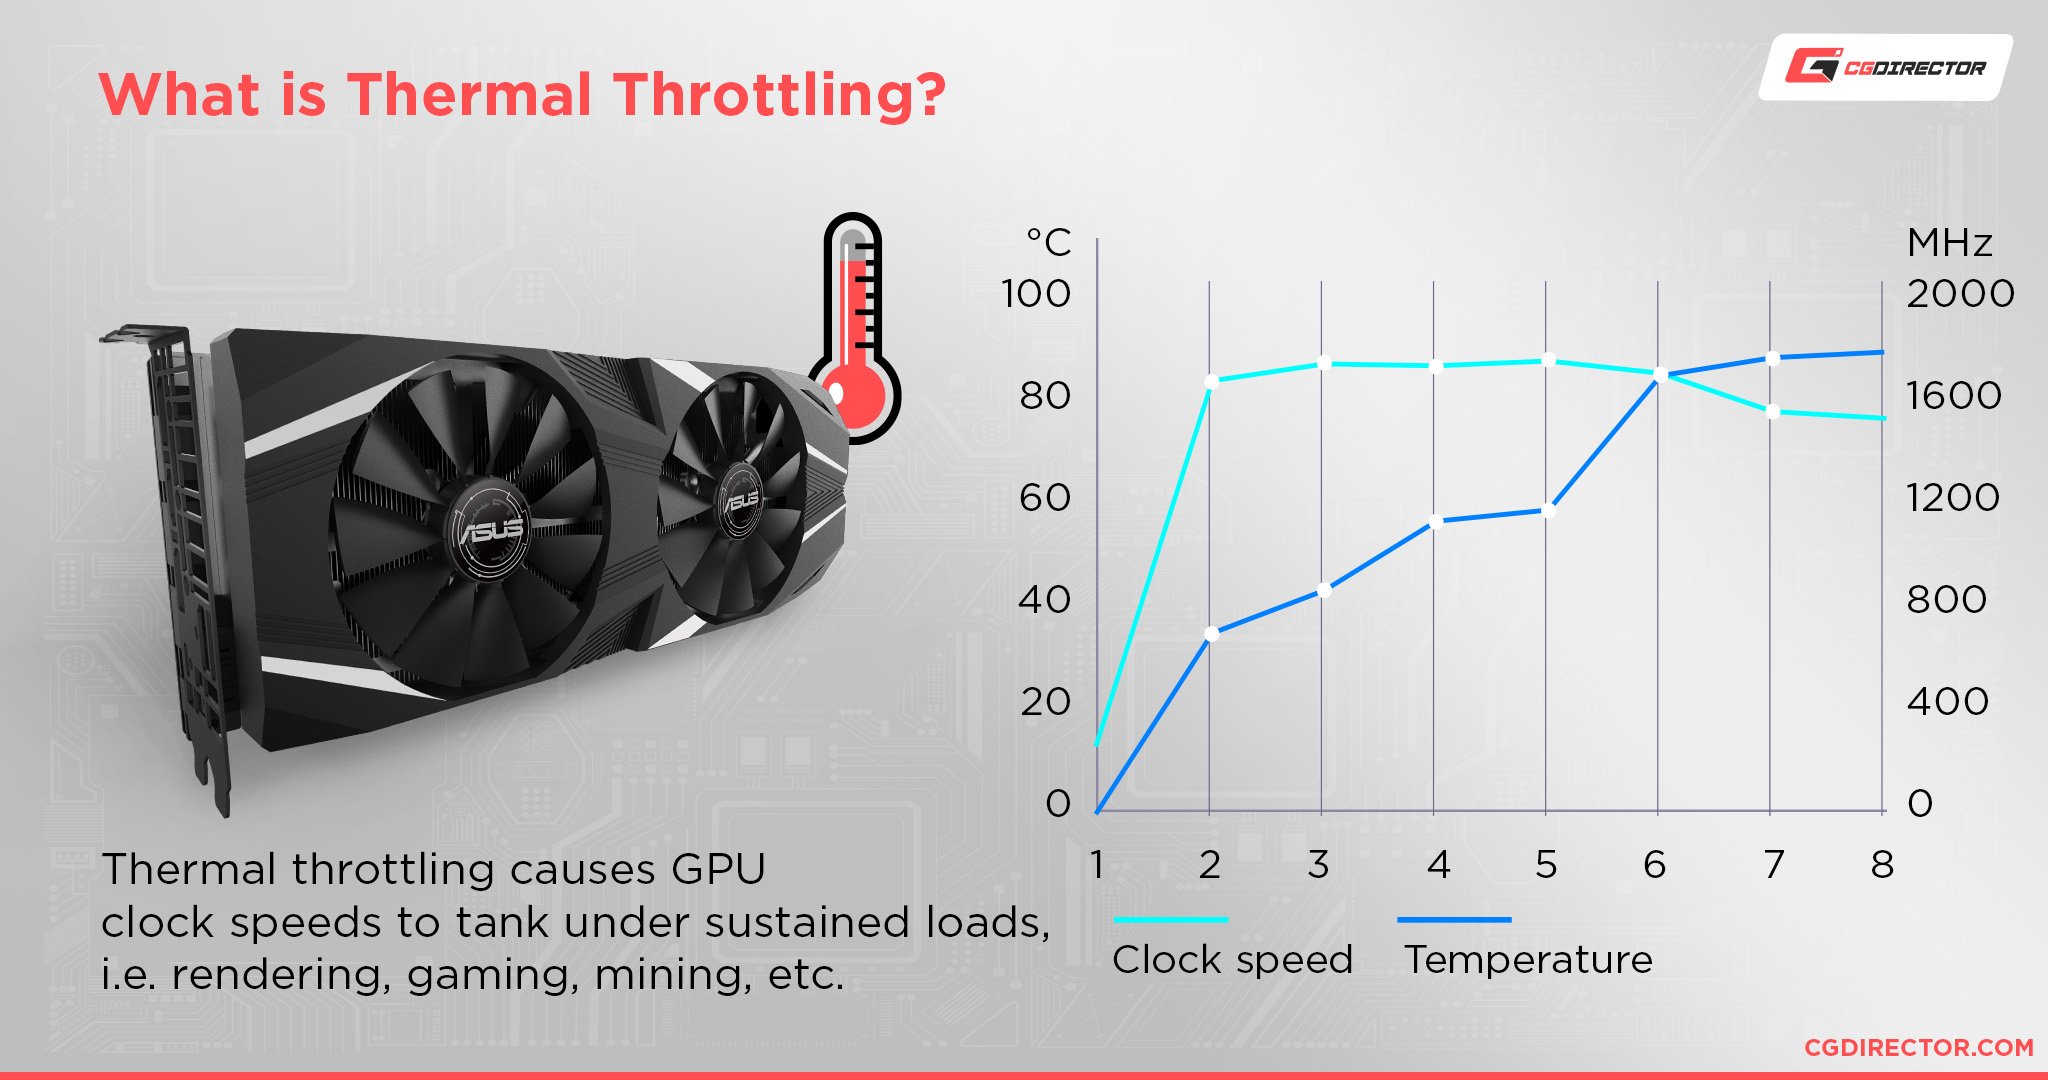
If you’re doing GPU rendering or another heavy-duty GPU-accelerated task, you basically don’t need to worry about your GPU temperatures as long as you aren’t pushing into or past your GPU’s thermal limit, which will introduce thermal throttling and potentially damage the card if allowed to overheat too far.
The reason why is pretty simple: these tasks are not real-time workloads like a game is, so input lag is not a factor.
That means you’re free to push your GPU to 100% utilization in workloads like these as long as you aren’t overheating, and the exact range of that is going to be GPU-dependent.
Generally speaking, I’d save becoming alarmed for the 95 degrees Celsius range and higher.
Even then, be sure to check the rated operating temperatures of your specific GPU, just to be sure that you actually do need to be concerned, since some cards actually are rated to run that high under load. MOST are not, though.
What Options Do I Have For Permanently Lowering My GPU Temperature?
Wondering what options are available to you for permanently lowering average and underloading GPU temperatures? These are my recommendations:
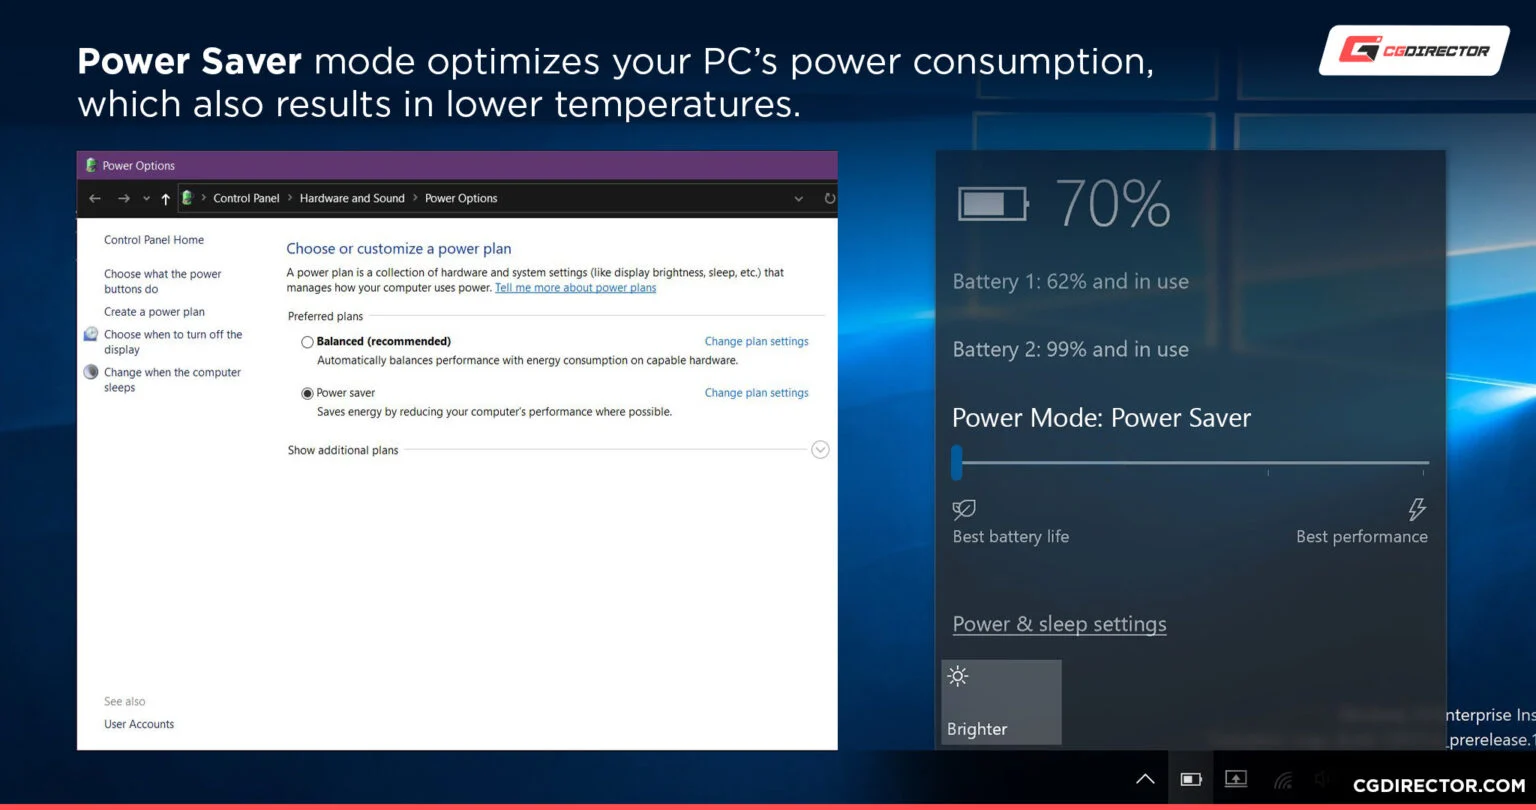
- Enable Power Saving or Balanced Power Plan — A straightforward solution built right into Windows. Reducing power to your GPU also reduces its heat.
- Undervolt Your GPU — Like the above option, but a bit more in-depth and actually without the performance penalty if done properly.
Undervolting is a bit out of the scale of this article, though, so I recommend PCWorld’s video, embedded below if you want to do this. - Replace GPU Thermal Paste — If no other steps have helped reduce your GPU temperatures, chances are you are due for a thermal paste replacement.
This means that you’ll need to take off your GPU cooler, clean off the dried thermal paste with a microfiber cloth and isopropyl alcohol, and re-apply a new thermal paste before putting it back together.
The instructions for doing this properly will depend on your specific GPU, be sure to research first! - Replace GPU Cooler For a Waterblock (Custom Loop Liquid Cooling Only) — Like the above step, but even more extreme. Get a waterblock for your GPU from EKWB and integrate it into your custom loop for the best possible GPU temperatures!
Over to You
And that’s it! I covered this question from all the angles I could think of and tried to plant the appropriate links and supplementary information to help you keep your rendering fast and your temperatures low.
I hope this article helped teach you how to check and monitor your GPU temperature and gave you a starting point on lowering or controlling it if needed!
Feel free to leave a comment below or head to the Forums if you have any other questions about GPU temperatures or GPU cooling. Until then or until next time, I hope you have a good one, and stay safe!
But also, don’t forget: the quickest holdover solution to concerningly high GPU temps will be enabling a Power Saver power plan in Windows until you’ve diagnosed the issue.
![Guide to Undervolting your GPU [Step by Step]](https://www.cgdirector.com/wp-content/uploads/media/2024/04/Guide-to-Undervolting-your-GPU-Twitter-594x335.jpg "Guide to Undervolting your GPU [Step by Step]")
![Is PNY a Good GPU Brand? [Updated]](https://www.cgdirector.com/wp-content/uploads/media/2023/12/Is-PNY-a-Good-GPU-Brand-Twitter-594x335.jpg "Is PNY a Good GPU Brand? [Updated]")
![Does Temperature Impact My GPU’s Performance? [Absolutely!]](https://www.cgdirector.com/wp-content/uploads/media/2023/09/Does-Temperature-Impact-My-GPU-Performance-Twitter-594x335.jpg "Does Temperature Impact My GPU’s Performance? [Absolutely!]")


0 Comments