March 7
Top 14 Tips, Tricks & Hacks to Speed Up Your Laptop and Make It Feel Like New
Laptops get slower over time, but this isn't always the way it has to be. Here are our proven methods to get your Laptop back up to speed in no time at all.
March 5
What is AHCI Mode in BIOS and Should You Use It?
AHCI and IDE are two options you can usually select from within your BIOS to make your Storage Drives run in specific modes. But what is AHCI and when should you use it?
March 5
Laptop Displays — Panel Types compared [IPS/OLED/TN]
The Quality of Laptop Displays can differ strongly from one model to another. And which panel type is right for you, depends a lot on your workloads. Let's compare!
March 2
Adobe Creative Cloud System Requirements & PC Recommendations
Adobe's Creative Cloud Software Suite is as popular as it is demanding on your PC-Hardware's Performance. Here's what you'll need to run it smoothly.
February 26
Where to Download 3D Models? Our Favorite Sites for 3D Artists
3D Models are needed in almost any 3D Project and there are sites galore that provide them. Just a couple of sites, though, are actually worth your time. Here's our list.
February 25
The Best PC Case Brands [2024 Update]
PC Cases come in all kinds of form factors, designs and brands, but which are the best brands to buy PC Cases from? Here's what our experience has shown over the years to be the best PC Case Brands.
February 23
Are Intel ARC GPUs Any Good? [2024 Update]
Intel has been making GPUs for quite some time now, but are they good enough yet for the kind of workloads you're looking to run? Or should you stay clear of them?
Benchmarks & Lists
Complete Guide to Building your own PC
Building your own PC is easy. It's also cheaper than buying pre-built and teaches you some of the inner workings of how a PC functions. We've put together a 4-Step Guide to finding and assembling the perfect Computer for yourself:
Hardware SEE All
Processor (CPU), Graphics Card (GPU), Memory (RAM), Motherboard
Guide to Undervolting your GPU [Step by Step]
UPDATED April 3, 2024Undervolting your GPU makes it run more efficiently, draws less power and keeps it cool and quiet. Here's how to undervolt your GPU in our Step-by-Step Guide.
How to Get a CPU Cooler off of a CPU [Un-stick Glued-On Cooler]
UPDATED March 21, 2024CPU-Coolers can become stuck onto your CPU with little chance to remove them. This is mostly due to old thermal paste. Here's how to get it off safely without damaging your CPU.
Why Is My GPU Slow? 8 Reasons Why Your GPU May Be Underperforming and How To Fix
UPDATED March 13, 2024GPUs don't always perform the way we expect them to. Here are the most common reasons why your GPU may be slow and how to fix them for good.
PC Builds SEE All
3D-Modeling, Rendering, Cinema 4D, Blender,After Effects
![AIO Pump: How To Tell It’s Working Properly [Liquid CPU Cooling] AIO Pump: How To Tell It’s Working Properly [Liquid CPU Cooling]](https://www.cgdirector.com/wp-content/uploads/media/2023/11/AIO-Pump-How-To-Tell-Its-Working-Properly-Twitter-825x464.jpg)
AIO Pump: How To Tell It’s Working Properly [Liquid CPU Cooling]
UPDATED December 2, 2023All-in-one Liquid Coolers can be a head scratcher to install, and after that's done you most certainly want to make sure the pump and entire AIO is working properly. Here's how.
Should You Build a PC? [7 Great Reasons]
UPDATED November 10, 2023Is GIGABYTE a Good Brand? [2024 Update]
UPDATED August 6, 2023Why are Desktop PCs Cheaper and Faster Than Laptops?
UPDATED August 3, 2023Apple Mac SEE All
How to Shut Down Applications in macOS [The Easy Way]
UPDATED January 22, 2024There comes a time when you have to shutdown your MacOS Applications either regularly or forcefully, especially if they become unresponsive. Here's how.
How to Check the Serial, Model, and Age of Your Mac Device or MacBook
UPDATED December 28, 2023Whether you're upgrading your Mac, buying new parts, looking to troubleshoot an issue or just want to know how old your device is, knowing its serial and model number is one of the first steps in doing so.
How to Use a MacBook With the Lid Closed? [Clamshell Mode]
UPDATED December 25, 2023Using your MacBook with an external monitor and peripherals works best when you close its lid and put it into the so-called clamshell mode. Here's how.
3D Animation & Rendering SEE All
Cinema 4D, Blender, Octane, Redshift, VRAY

Where to Download 3D Models? Our Favorite Sites for 3D Artists
UPDATED February 26, 20243D Models are needed in almost any 3D Project and there are sites galore that provide them. Just a couple of sites, though, are actually worth your time. Here's our list.
Enscape System Requirements and PC Recommendations
UPDATED July 15, 2023Adobe Animate System Requirements and PC Recommendations [2024 Update]
UPDATED July 9, 2023Solidworks System Requirements & PC Recommendations [2024 Update]
UPDATED August 27, 2023Video Editing SEE All
Premiere Pro, Rendering, Solid State Drive (SSD)
Best CPU for Video Encoding [2024 Update]
UPDATED January 30, 2024Video Encoding is CPU demanding and will eat into your editing time if not taken into consideration when buying or upgrading a PC. A closer look at encoding performance.
Are MacBooks Good for Video Editing? [2024 Update]
UPDATED November 14, 2023MacBooks certainly come at a price, but they also pack a lot of performance for high-end workloads, right? Well, Video Editing is such a heavy-duty workload and we take a look at whether MacBooks are up to it.
How Long Does It Take To Render a Video? (It depends)
UPDATED July 12, 2022Video Render Time depends on a lot of different things. The type of Footage you're using, your project complexity, and, of course, your Hardware's performance.
Benchmarks SEE All
Cinema 4D, Octane, Redshift, VRAY, NVIDIA

Redshift Benchmark Results (Updated)
UPDATED April 11, 2024Extensive Redshift Benchmark Results List with all modern GPUs, Operating Systems, CPUs and Multi-GPU-Setups. Find the best performing GPU for Redshift.
Corona Renderer Benchmark Results [Updated]
UPDATED November 15, 2023Cinema 4D Viewport Performance Benchmark & Scores (Updated Results)
UPDATED January 16, 2024Cinebench 2024 Scores [CPU & GPU] (Updated Results)
UPDATED January 19, 2024Laptops SEE All
Top 14 Tips, Tricks & Hacks to Speed Up Your Laptop and Make It Feel Like New
UPDATED March 7, 2024Laptops get slower over time, but this isn't always the way it has to be. Here are our proven methods to get your Laptop back up to speed in no time at all.
Laptop Displays — Panel Types compared [IPS/OLED/TN]
UPDATED March 5, 2024The Quality of Laptop Displays can differ strongly from one model to another. And which panel type is right for you, depends a lot on your workloads. Let's compare!
The Cheapest Creator Laptop Is Still Amazing — M1 MacBook Air in 2024
UPDATED February 19, 2024Graphic Design SEE All
Photoshop, Monitor, Memory (RAM)

Top 9 Creative Things to Do on a Computer When You’re Bored
UPDATED December 22, 2023You're a creative and the computer is your toolset. Here are our 9 favorite creative things that'll beat boredom in no time. And that'll boost your mood & skills as a nice bonus.
Best Laptops for After Effects [2024 Update]
UPDATED June 14, 2023Figma System Requirements & PC Recommendations
UPDATED December 26, 2022Adobe XD System Requirements & PC Recommendations
UPDATED December 21, 2022Software SEE All
BIOS, System Requirements, Driver
How To Update The UEFI/BIOS on an ASUS Motherboard
UPDATED March 8, 2024ASUS Motherboards are extremely popular and thankfuly updating its UEFI/BIOS isn't too difficult for most models. Here's how.
What is AHCI Mode in BIOS and Should You Use It?
UPDATED March 5, 2024AHCI and IDE are two options you can usually select from within your BIOS to make your Storage Drives run in specific modes. But what is AHCI and when should you use it?
Adobe Creative Cloud System Requirements & PC Recommendations
UPDATED March 2, 2024Adobe's Creative Cloud Software Suite is as popular as it is demanding on your PC-Hardware's Performance. Here's what you'll need to run it smoothly.
Reviews SEE All
Processor (CPU), Graphics Card (GPU), Memory (RAM), Motherboard
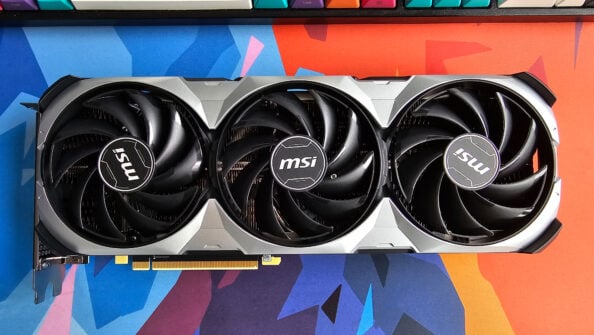
NVIDIA RTX 4080 SUPER GPU Review [Content Creation, Rendering, AI]
UPDATED February 12, 2024Nvidia's RTX 4080 SUPER GPU Refresh is put through content creation and rendering benchmarks in our review to find out if its performance is worth investing your money into.
NVIDIA RTX 4070 Ti SUPER Review in CG Workloads – Better, but not quite there yet
UPDATED January 26, 2024We review the Nvidia RTX 4070 Ti SUPER in various CG-related Workloads, such as Rendering in Octane, Redshift, V-Ray, or Content Creation Apps such as After Effects and Premiere Pro.
GeForce RTX 4070 SUPER Reviewed for CG Workloads: NVIDIA’s New Value King [Review]
UPDATED January 16, 2024NVIDIA's RTX 4070 SUPER stands out as the new value king for creative professionals. Find detailed benchmarks in our comprehensive review!
Motion Design SEE All
After Effects, Rendering, Processor (CPU)

How to Export an MP4 from After Effects (4 possible Ways)
UPDATED March 1, 2022Exporting an MP4 from After Effects is more difficult than it should be. Here are 4 different ways you can use to output an MP4 Video from After Effects.
Using the Wiggle Expression in After Effects – Ultimate Guide
UPDATED March 1, 2022Best Workstation Computer For After Effects [2024 Guide]
UPDATED January 3, 2023CAD SEE All
Rendering, Pc/Workstation, Laptop
Do you need a Professional GPU for CAD Workloads? [AMD PRO, Nvidia Quadro, Intel ARC Pro]
UPDATED June 13, 2023CAD workloads require PRO GPUs, right? Well, not necessarily. In fact, most times you get higher performance at a lower price if you don't get a PRO GPU from AMD, Nvidia or Intel for CAD Workloads.
AutoCAD System Requirements & PC Recommendations
UPDATED July 3, 2023Autodesk's AutoCAD is among the most popular Applications for computer-aided design and drafting. But what kind of a PC will you need to make it run smoothly?
Fusion 360 System Requirements & PC Recommendations
UPDATED August 27, 2023Fusion 360's System Requirements are, thankfully, easily satisfied. It's one of the leading computer-aided design programs for manufacturing, modeling, engineering, product and printed circuit board design, and everything in between.
Troubleshoot & Fix SEE All
Processor (CPU), Graphics Card (GPU), Memory (RAM), Motherboard
![How to Get a CPU Cooler off of a CPU [Un-stick Glued-On Cooler] How to Get a CPU Cooler off of a CPU [Un-stick Glued-On Cooler]](https://www.cgdirector.com/wp-content/uploads/media/2024/03/How-to-get-CPU-Cooler-off-CPU-Twitter-copy-825x464.jpg)
How to Get a CPU Cooler off of a CPU [Un-stick Glued-On Cooler]
UPDATED March 21, 2024CPU-Coolers can become stuck onto your CPU with little chance to remove them. This is mostly due to old thermal paste. Here's how to get it off safely without damaging your CPU.

![Guide to Undervolting your GPU [Step by Step] Guide to Undervolting your GPU [Step by Step]](https://www.cgdirector.com/wp-content/uploads/media/2024/04/Guide-to-Undervolting-your-GPU-Twitter-825x464.jpg)
![Best Headphone Brands to use with your PC [2024 Updated] Best Headphone Brands to use with your PC [2024 Updated]](https://www.cgdirector.com/wp-content/uploads/media/2024/03/Best-Headphone-Brands-Explained-Twitter-825x464.jpg)


![Laptop Displays — Panel Types compared [IPS/OLED/TN] Laptop Displays — Panel Types compared [IPS/OLED/TN]](https://www.cgdirector.com/wp-content/uploads/media/2024/03/Laptop-Displays-—-Which-Panel-Technology-Should-You-Go-With-Twitter-420x236.jpg)


![The Best PC Case Brands [2024 Update] The Best PC Case Brands [2024 Update]](https://www.cgdirector.com/wp-content/uploads/media/2024/02/The-Best-PC-Case-Brands-Twitter-420x236.jpg)
![Are Intel ARC GPUs Any Good? [2024 Update] Are Intel ARC GPUs Any Good? [2024 Update]](https://www.cgdirector.com/wp-content/uploads/media/2024/02/Are-Intel-ARC-GPUs-Any-Good-Twitter-420x236.jpg)



![Guide to Undervolting your GPU [Step by Step] Guide to Undervolting your GPU [Step by Step]](https://www.cgdirector.com/wp-content/uploads/media/2024/04/Guide-to-Undervolting-your-GPU-Twitter-594x335.jpg)
![How to Get a CPU Cooler off of a CPU [Un-stick Glued-On Cooler] How to Get a CPU Cooler off of a CPU [Un-stick Glued-On Cooler]](https://www.cgdirector.com/wp-content/uploads/media/2024/03/How-to-get-CPU-Cooler-off-CPU-Twitter-copy-594x335.jpg)
![Should You Build a PC? [7 Great Reasons] Should You Build a PC? [7 Great Reasons]](https://www.cgdirector.com/wp-content/uploads/media/2023/11/Should-You-Build-a-PC-7-Reasons-For-Building-a-PC-Twitter-420x236.jpg)
![Is GIGABYTE a Good Brand? [2024 Update] Is GIGABYTE a Good Brand? [2024 Update]](https://www.cgdirector.com/wp-content/uploads/media/2023/07/Is-GIGABYTE-a-Good-Brand-Twitter-420x236.jpg)

![How to Shut Down Applications in macOS [The Easy Way] How to Shut Down Applications in macOS [The Easy Way]](https://www.cgdirector.com/wp-content/uploads/media/2024/01/How-to-Shut-Down-Applications-in-macOS-Twitter-594x335.jpg)

![How to Use a MacBook With the Lid Closed? [Clamshell Mode] How to Use a MacBook With the Lid Closed? [Clamshell Mode]](https://www.cgdirector.com/wp-content/uploads/media/2023/12/How-to-Use-a-MacBook-With-the-Lid-Closed-Clamshell-Mode-Twitter-594x335.jpg)

![Adobe Animate System Requirements and PC Recommendations [2024 Update] Adobe Animate System Requirements and PC Recommendations [2024 Update]](https://www.cgdirector.com/wp-content/uploads/media/2023/06/Adobe-Animate-System-Requirements-and-PC-Recommendations-Twitter-420x236.jpg)
![Solidworks System Requirements & PC Recommendations [2024 Update] Solidworks System Requirements & PC Recommendations [2024 Update]](https://www.cgdirector.com/wp-content/uploads/media/2023/05/Solidworks-System-Requirements-PC-Recommendations-Twitter-420x236.jpg)
![Best CPU for Video Encoding [2024 Update] Best CPU for Video Encoding [2024 Update]](https://www.cgdirector.com/wp-content/uploads/media/2022/02/Best-CPU-For-Video-Encoding-Twitter-594x335.jpg)
![Are MacBooks Good for Video Editing? [2024 Update] Are MacBooks Good for Video Editing? [2024 Update]](https://www.cgdirector.com/wp-content/uploads/media/2023/11/Are-M1-and-M2-MacBooks-Good-for-Video-Editing-Twitter-594x335.jpg)
![Corona Renderer Benchmark Results [Updated] Corona Renderer Benchmark Results [Updated]](https://www.cgdirector.com/wp-content/uploads/media/2020/11/Corona-Benchmark-Results-Twitter_1200x675-420x236.jpg)
![Cinebench 2024 Scores [CPU & GPU] (Updated Results) Cinebench 2024 Scores [CPU & GPU] (Updated Results)](https://www.cgdirector.com/wp-content/uploads/media/2023/09/Cinebench-2024-Scores-Results-Updated-420x236.jpg)

![Laptop Displays — Panel Types compared [IPS/OLED/TN] Laptop Displays — Panel Types compared [IPS/OLED/TN]](https://www.cgdirector.com/wp-content/uploads/media/2024/03/Laptop-Displays-—-Which-Panel-Technology-Should-You-Go-With-Twitter-594x335.jpg)

![Best Laptops for After Effects [2024 Update] Best Laptops for After Effects [2024 Update]](https://www.cgdirector.com/wp-content/uploads/media/2023/05/Best-Laptops-for-After-Effects-Twitter-420x236.jpg)



![NVIDIA RTX 4080 SUPER GPU Review [Content Creation, Rendering, AI] NVIDIA RTX 4080 SUPER GPU Review [Content Creation, Rendering, AI]](https://www.cgdirector.com/wp-content/uploads/media/2024/02/20240131_150445-594x335.jpg)
![GeForce RTX 4070 SUPER Reviewed for CG Workloads: NVIDIA’s New Value King [Review] GeForce RTX 4070 SUPER Reviewed for CG Workloads: NVIDIA’s New Value King [Review]](https://www.cgdirector.com/wp-content/uploads/media/2024/01/CGDirector-Nvidia-RTX-4070-SUPER-Review-18-594x335.jpg)

![Best Workstation Computer For After Effects [2024 Guide] Best Workstation Computer For After Effects [2024 Guide]](https://www.cgdirector.com/wp-content/uploads/media/2017/03/BestWorkstationForAfterEffects-Twitter_1200x675-420x236.jpg)
![Do you need a Professional GPU for CAD Workloads? [AMD PRO, Nvidia Quadro, Intel ARC Pro] Do you need a Professional GPU for CAD Workloads? [AMD PRO, Nvidia Quadro, Intel ARC Pro]](https://www.cgdirector.com/wp-content/uploads/media/2023/06/Do-you-need-a-Professional-GPU-for-CAD-Workloads-Twitter-594x335.jpg)


![Graphics Card (GPU) Not Detected [How to Fix] Graphics Card (GPU) Not Detected [How to Fix]](https://www.cgdirector.com/wp-content/uploads/media/2024/01/Graphics-Card-GPU-Not-Detected-CGDIRECTOR-Twitter-420x236.jpg)
