 by
by ")
TABLE OF CONTENTS
Cinebench Scores are a great way to get an impression of how fast a CPU is in different types of workloads.
Whether you’re planning to build a Computer for 3D Rendering, Gaming, Streaming, or would just like to see how different CPUs compare to each other, a clean Cinebench Scores list of the most current CPUs, frequently updated & neatly sortable, should put a smile on anyone’s face.
As the Cinebench Benchmark tests the Multi-Core Performance as well as the performance of a single core (usually under Turbo-Boost), it is a great Benchmark for finding the best Processors for your needs.
That could be heavily Multi-Core optimized workloads, such as Rendering, or heavily Single-Core restricted workloads, such as Viewport-Performance as in Cinema 4D or (still) Gaming.
Updated Cinebench R23 Benchmark results are available here.
Cinebench R15 Scores List
You will find two Score Types in this list:
- Multi-Core-Score, tells you how fast the CPU will be in Multi-Core optimized tasks such as CPU Rendering
- Single-Core Score is a good metric for snappiness and Program responsiveness, as well as specific tasks that make use of only a few cores
▮ = AMD | ▮ = Intel
| CPU Name | Cores | Ghz | Single Score | Multi Score |
|---|---|---|---|---|
| AMD Threadripper PRO 3995WX | 64 | 2.7 | 194 | 9788 |
| Intel i5 11600K | 6 | 3.9 | 245 | 1760 |
| Intel i9 11900K | 8 | 3.5 | 262 | 2515 |
| Intel i5 12600K | 10 | 3.7 | 274 | 2596 |
| Intel i7 12700K | 12 | 3.6 | 286 | 3328 |
| Intel i9 12900K | 16 | 3.2 | 294 | 4112 |
| AMD Ryzen 5 5600X | 6 | 3.7 | 257 | 1963 |
| AMD Ryzen 7 5800X | 8 | 3.8 | 268 | 2607 |
| AMD Ryzen 9 5900X | 12 | 3.7 | 271 | 3678 |
| AMD Ryzen 9 5950X | 16 | 3.4 | 276 | 4563 |
| Intel i9 10940X | 14 | 3.3 | 201 | 3117 |
| Intel i9 10920X | 12 | 3.5 | 200 | 2734 |
| Intel i9 10900X | 10 | 3.7 | 198 | 2358 |
| AMD Ryzen 3 3300X | 4 | 3.8 | 202 | 1129 |
| Intel i3 10320 | 4 | 3.8 | 195 | 1080 |
| Intel i5 10500 | 6 | 3.1 | 197 | 1491 |
| Intel i7 10700K | 8 | 3.8 | 223 | 2344 |
| Intel i9 10900K | 10 | 3.7 | 225 | 2677 |
| AMD Threadripper 3990X | 64 | 2.9 | 204 | 10449 |
| Intel i9 10980XE | 18 | 3.0 | 211 | 3799 |
| AMD Threadripper 3970X | 32 | 3.7 | 208 | 7398 |
| AMD Threadripper 3960X | 24 | 3.8 | 208 | 5933 |
| AMD Epyc 7301 | 16 | 2.2 | 119 | 2033 |
| AMD Epyc 7281 | 16 | 2.2 | 119 | 2033 |
| Intel XEON E5-2699 v4 | 22 | 2.2 | 120 | 2460 |
| Intel XEON W-2102 | 4 | 2.9 | 124 | 485 |
| AMD Athlon 200GE | 2 | 3.2 | 125 | 357 |
| Intel XEON E5-2620 v4 | 8 | 2.1 | 125 | 1096 |
| AMD Epyc 7251 | 8 | 2.1 | 128 | 1093 |
| Intel XEON E5-2650 v4 | 12 | 2.2 | 128 | 1589 |
| AMD Epyc 7351 | 16 | 2.4 | 128 | 2184 |
| AMD Epyc 7351P | 16 | 2.4 | 128 | 2184 |
| AMD Ryzen 3 2200U | 2 | 2.5 | 129 | 318 |
| AMD Ryzen 5 2500U | 4 | 2.0 | 130 | 584 |
| Intel Xeon Silver 4108 | 8 | 1.8 | 130 | 1014 |
| Intel Xeon Silver 4112 | 4 | 2.6 | 131 | 665 |
| Intel Xeon Silver 4109T | 8 | 2.0 | 131 | 1103 |
| Intel Xeon Silver 4110 | 8 | 2.1 | 131 | 1148 |
| Intel Xeon Silver 4114 | 10 | 2.2 | 131 | 1439 |
| Intel Xeon Silver 4116 | 12 | 2.1 | 131 | 1722 |
| AMD Epyc 7401P | 24 | 2.0 | 132 | 3156 |
| AMD Epyc 7401 | 24 | 2.0 | 132 | 3156 |
| AMD Epyc 7551P | 32 | 2.0 | 132 | 3838 |
| AMD Epyc 7501 | 32 | 2.0 | 132 | 3912 |
| AMD Ryzen 3 2300U | 4 | 2.0 | 134 | 480 |
| AMD Ryzen 5 1400 | 4 | 3.2 | 134 | 787 |
| Intel XEON W-2104 | 4 | 3.2 | 137 | 531 |
| AMD Ryzen 7 1700 | 8 | 3.0 | 137 | 1426 |
| AMD Athlon 300U | 2 | 2.6 | 138 | 344 |
| AMD Ryzen 3 3200U | 2 | 2.6 | 138 | 344 |
| AMD Ryzen 5 3500U | 4 | 2.1 | 138 | 620 |
| AMD Ryzen 7 2700U | 4 | 2.2 | 138 | 662 |
| Intel XEON E5-2687W v4 | 12 | 3.0 | 138 | 1860 |
| AMD Ryzen 3 3300U | 4 | 2.1 | 139 | 510 |
| AMD Epyc 7451 | 24 | 2.3 | 141 | 3277 |
| AMD Epyc 7601 | 32 | 2.2 | 141 | 4068 |
| AMD Ryzen 3 2200G | 4 | 3.5 | 142 | 576 |
| AMD Ryzen 5 3550H | 4 | 2.1 | 142 | 733 |
| AMD Ryzen 5 1600 | 6 | 3.2 | 145 | 1147 |
| AMD Ryzen 7 1700X | 8 | 3.4 | 145 | 1540 |
| AMD Ryzen 7 3700U | 4 | 2.3 | 146 | 701 |
| Intel i7 6800K | 6 | 3.4 | 146 | 1096 |
| Intel i7 6950X | 10 | 3.0 | 147 | 1788 |
| Intel i5 9400T | 6 | 1.8 | 150 | 710 |
| AMD Ryzen 5 1500X | 4 | 3.5 | 152 | 803 |
| Intel i7 6900K | 8 | 3.2 | 154 | 1562 |
| Intel i5 9500T | 6 | 2.2 | 155 | 811 |
| AMD Ryzen 5 2400G | 4 | 3.6 | 156 | 826 |
| Intel i7 6850K | 6 | 3.6 | 156 | 1235 |
| Intel i5 8250U | 4 | 1.6 | 157 | 549 |
| Intel i5 9600T | 6 | 2.3 | 159 | 908 |
| AMD Ryzen 3750H | 4 | 2.3 | 161 | 802 |
| Intel i5 8400 | 6 | 2.8 | 161 | 966 |
| AMD Ryzen 5 1600X | 6 | 3.3 | 161 | 1250 |
| AMD Ryzen 7 1800X | 8 | 3.6 | 161 | 1613 |
| Intel Xeon Gold 6140 | 18 | 2.3 | 161 | 2785 |
| Intel Xeon Gold 6138 | 20 | 2.0 | 161 | 3069 |
| Intel Xeon Gold 6152 | 22 | 2.1 | 161 | 3157 |
| Intel Xeon Gold 6150 | 18 | 2.7 | 161 | 3188 |
| Intel Xeon Gold 6148 | 20 | 2.4 | 161 | 3310 |
| Intel Xeon Platinum 8160 | 24 | 2.1 | 161 | 3444 |
| Intel Xeon Platinum 8170 | 26 | 2.1 | 161 | 3596 |
| Intel Xeon Platinum 8164 | 26 | 2.0 | 161 | 3720 |
| Intel Xeon Platinum 8168 | 24 | 2.7 | 161 | 4002 |
| Intel Xeon Gold 6154 | 18 | 3.0 | 162 | 3210 |
| AMD Ryzen 5 2600 | 6 | 3.4 | 163 | 1307 |
| AMD Ryzen 7 2700 | 8 | 3.2 | 165 | 1526 |
| Intel Xeon Platinum 8176 | 28 | 2.1 | 165 | 3873 |
| Intel Xeon Platinum 8180 | 28 | 2.5 | 165 | 4355 |
| AMD Threadripper 1950X | 16 | 3.4 | 166 | 3062 |
| Intel i7 8550U | 4 | 1.8 | 167 | 564 |
| Intel XEON W-2123 | 4 | 3.6 | 167 | 806 |
| AMD Threadripper 1900X | 8 | 3.8 | 168 | 1711 |
| AMD Threadripper 1920X | 12 | 3.5 | 168 | 2431 |
| Intel i5 8300H | 4 | 2.3 | 169 | 795 |
| AMD Threadripper 2970X | 24 | 3.0 | 170 | 4323 |
| Intel i5 8265U | 4 | 1.6 | 171 | 549 |
| Intel i5 8500 | 6 | 3.0 | 174 | 934 |
| AMD Threadripper 2990WX | 32 | 3.0 | 174 | 5224 |
| Intel i7 8650U | 4 | 1.9 | 175 | 614 |
| Intel i5 7600K | 4 | 3.8 | 176 | 701 |
| AMD Ryzen 5 2600X | 6 | 3.6 | 176 | 1373 |
| Intel i7 7820X | 8 | 3.6 | 176 | 1734 |
| AMD Threadripper 2920X | 12 | 3.5 | 176 | 2604 |
| Intel i5 9400F | 6 | 2.9 | 177 | 987 |
| Intel i5 9400 | 6 | 2.9 | 177 | 987 |
| Intel i7 5960X | 8 | 3.0 | 177 | 1324 |
| Intel i9 9820X | 10 | 3.3 | 177 | 2170 |
| Intel i7 8565U | 4 | 1.8 | 178 | 564 |
| Intel i5 8400H | 4 | 2.5 | 178 | 819 |
| Intel i5 8600 | 6 | 3.1 | 178 | 959 |
| AMD Threadripper 2950X | 16 | 3.5 | 179 | 3210 |
| Intel i7 8750H | 6 | 2.2 | 180 | 1063 |
| AMD Ryzen 7 2700X | 8 | 3.7 | 180 | 1783 |
| Intel i5 9500F | 6 | 3.0 | 182 | 1016 |
| Intel i5 9500 | 6 | 3.0 | 182 | 1016 |
| Intel i7 8850H | 6 | 2.6 | 182 | 1023 |
| Intel i5 8600K | 6 | 3.6 | 183 | 1040 |
| Intel Xeon 2176M | 6 | 2.7 | 183 | 1070 |
| Intel i7 7800X | 6 | 3.5 | 184 | 1333 |
| Intel i9 7960X | 16 | 2.8 | 184 | 3161 |
| Intel i9 9960X | 16 | 3.1 | 184 | 3211 |
| Intel i9 7980XE | 18 | 2.6 | 184 | 3455 |
| Intel i5 9600 | 6 | 3.1 | 186 | 1042 |
| Intel XEON W-2195 | 18 | 2.3 | 187 | 2949 |
| Intel i9 9920X | 12 | 3.5 | 188 | 2438 |
| Intel i9 7920X | 12 | 2.9 | 188 | 2438 |
| Intel i9 7940X | 14 | 3.1 | 188 | 2849 |
| Intel i9 9940X | 14 | 3.3 | 190 | 3173 |
| Intel i7 7700K | 4 | 4.2 | 191 | 996 |
| Intel XEON W-2155 | 10 | 3.3 | 191 | 2021 |
| Intel i7 9750H | 6 | 2.6 | 192 | 1233 |
| Intel i9 7900X | 10 | 3.3 | 193 | 2169 |
| Intel i9 9800X | 8 | 3.8 | 194 | 1826 |
| Intel i7 8700 | 6 | 3.2 | 195 | 1420 |
| Intel i7 7740X | 4 | 4.3 | 196 | 986 |
| AMD Ryzen 5 3600 | 6 | 3.6 | 197 | 1581 |
| Intel i9 9880H | 8 | 2.3 | 197 | 1721 |
| Intel i9 9900X | 10 | 3.5 | 197 | 2274 |
| Intel i9 9980XE | 18 | 3.0 | 199 | 3740 |
| Intel i5 9600KF | 6 | 3.7 | 200 | 1068 |
| Intel i5 9600K | 6 | 3.7 | 200 | 1068 |
| AMD Ryzen 5 3600X | 6 | 3.8 | 202 | 1795 |
| Intel i7 8700K | 6 | 3.7 | 205 | 1428 |
| Intel i9 9980HK | 8 | 2.4 | 205 | 1930 |
| AMD Ryzen 7 3700X | 8 | 3.6 | 205 | 2116 |
| Intel i9 8950HK | 6 | 2.9 | 206 | 1269 |
| AMD Ryzen 7 3800X | 8 | 3.9 | 209 | 2166 |
| Intel i7 9700KF | 8 | 3.6 | 212 | 1542 |
| Intel i7 9700K | 8 | 3.6 | 212 | 1542 |
| AMD Ryzen 9 3900X | 12 | 3.8 | 213 | 3168 |
| Intel i7 8086K | 6 | 3.7 | 215 | 1386 |
| AMD Ryzen 9 3950X | 16 | 3.5 | 217 | 4070 |
| Intel i9 9900KF | 8 | 3.6 | 218 | 2081 |
| Intel i9 9900K | 8 | 3.6 | 218 | 2081 |
| Intel i9 9990XE | 14 | 4.0 | 221 | 3732 |
| Intel i9 9900KS | 8 | 4.0 | 222 | 2202 |
| CPU Name | Cores | GHz | Single Score | Multi Score |
Download Cinebench R15 here
Go get Cinebench R15 Benchmark for your System, it’s free, and test-drive your CPU to be able to compare it with the ones in this list.
Also, It’s good to know if your CPU actually delivers what it is supposed to, or if you might be throttling it or running it sub-optimally.
How to read these Scores
Ok, some more info about these Cinebench Results: Cinebench Scores are linear.
This means a CPU that scores 2000 Cinebench points will be twice as fast (in Cinema 4D Rendering) as a CPU that scores 1000 Cinebench points.
So far so good.
What is a good Cinebench Score?
All these Scores are difficult to grasp if you don’t put them into context.
I am asked what a good Cinebench Score actually is almost every day and as so often there is no definite answer. It depends on what the CPU you are benching is supposed to be able to do.
Are you mainly writing texts in Open Office? A Cinebench Score of 250 is good. For your specific use case!
Are you rendering a lot in 3D Software? In this case, a Cinebench Score would be good, if the CPU that is being benched renders fast enough for you to finish your projects on time.
Usually, a dedicated rendering PC should have upwards of 2000 Cinebench points. The more the better.
Are you mainly gaming on your Computer? Then you will have to look at the Cinebench Single-Core Score. For 4K 90FPS gaming, you should have 170 Cinebench Single-Core Points or higher.
Also, you would need upwards of 4 Cores. That would mean you should have a Multi-Core Cinebench Score of 700 or more.
Cinebench does not scale well in the high-score (5000+) area
This wasn’t a problem when CPUs used to reach only around 1000 Cinebench Points but becomes a problem more and more nowadays, especially with the extreme high-core count CPUs such as the AMD Threadrippers or Server CPUs such as Dual / Quad / Octa Intel XEONs and AMD Epycs.
Because Cinebench divides the rendering task into buckets, there is a possibility that at the end of the benchmark run, there are only one or two buckets left that are actually rendering because these buckets might take a bit longer (maybe because the rendered Image is more complex in these buckets).
Of course, this means, that the rest of the cores lie dormant during this time, and this can distort the result extremely.
We can say the same about the startup time of the rendering task. It might take half a second or a second to distribute all the rendering tasks to the cores, and considering that the entire benchmark-run only takes about 5 seconds on 64 Cores, half a second can make a huge difference.
This is also why you don’t see many server-grade CPUs with high-core counts being featured in Cinebench R15 Benchmarks.
Multi-Core vs Single-Core Cinebench R15 Scores
The Cinebench-Multi Score uses all available CPU-Cores for rendering. Cinebench-Single Scores will only use one CPU-Core for rendering.
Why would we need the single-core score?
One simple reason:
There are lots of Software-Parts in 3D-Softwares and Games that rely on and can only be calculated on a single core, and won’t run faster if more Cores are available.
An example:
Think about simulating a Liquid. Every simulated frame depends on the previous frames.
You can’t tell 10 cores to simulate 10 frames, because you have to simulate all frames up until the frame you want to simulate, or else you don’t know what the liquid is doing or where it is at that particular frame.
This means, only one Core at a time can simulate a coherent liquid.
Here you will need a maximum Single-Core Cinebench Score.
There are ways around this of course, as in using multiple liquids that intersect each other and together look like a higher resolution liquid.
This then could be calculated on multiple CPU-Cores, every individual liquid part on another core.
Here you would want a maximum Multi-Core Cinebench Score.
Or take a Game-Engine:
As there is so much dependent on User interaction, the CPU has to wait until the User actually fires off a Bullet or opens a door to a new area, meaning the CPU can’t use its other cores to pre-calculate what you will be doing, because it can’t know what you will be doing.
Again, a high Single-Core Cinebench Score is of great use here.
High Single-Core Cinebench R15 Scores makes PC snappier
Another great example, why the Single-Core Cinebench Score is very important for CG Artists, is because the 3D Viewport in 3D Softwares such as Cinema 4D, Maya, 3dsmax, Blender, and the like, is very dependent on the speed of a single CPU-Core.
As soon as you have a hierarchy of deformers and modifiers on a mesh, only one CPU-Core can calculate the form of this mesh.
The CPU Core has to step through the hierarchy of your deformers and modifiers until it reaches the end of the chain.
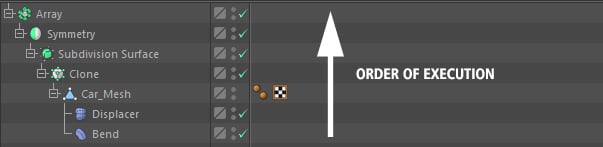
No other CPU-Cores can help in this matter, as only the one core that is calculating the mesh hierarchy knows how the mesh actually looks at a given hierarchy and calculates the form of a mesh that is being modified by deformers.
Multiple Cores are useful if you have multiple meshes that can be worked on independently by different CPU-Cores.
Here, depending on the Software, a high Multi-Core Cinebench Score will be of use.
The 3 steps in finding the CPU you need by looking at the Cinebench Scores
1. Value: Know your budget and see what CPU has the highest Cinebench Scores in this Price range
2. Multi-Core Cinebench Score: The higher the better. Good for CPU-Rendering, and tasks that are parallelizable. Good for when the Computer renders on its own, without you having to sit and watch it work.
3. Single-Core Cinebench Score: Higher is better. Best for Viewport Performance and interaction with the PC. This usually impacts your active working speed & snappiness on the PC the most.
Multi-Core to Single-Core Cinebench Score ratio
This is an interesting metric, as one would think the Multi-Core Cinebench Score should be exactly number-of-cores x the single-core Cinebench score.
Usually, though, the multi-Core Cinebench Score is somewhat lower than this since features such as Turbo-Boost play a large role when using only one core.
Turbo-Boost is when the CPU automatically clocks higher when using one core (or not all cores), as there is more headroom in terms of power draw and temperature.
So a single core could clock as high as 5 GHz but an all-core bench will run at only 4 GHz on all cores.
This is the main reason why the Multi and Single-Core Cinebench R15 Scores can’t be directly calculated.
AMD or INTEL
Intel has had a single-Core advantage for some time now, meaning if you are looking for a CPU, that you can actively work on as fast as possible, with the System reacting as snappy as possible, it is usually a good idea to get an Intel CPU such as the i7 8700K or i7 8086K.
These CPUs will be amongst the highest Single-Core Cinebench Scores in the list.
Beware though, these two CPUs don’t have the best value in terms of multi-Core Performance and only have 16 PCIe-lanes, so rendering with lots of GPUs would require a different CPU for maximum speed.
AMD has recently introduced the RYZEN CPU Family, which has great multi-Core Value but doesn’t quite reach Intel in terms of Single-Core Speeds yet.
RYZEN and Threadripper CPUs are excellent for CPU Rendering and have the highest Multi-Core Cinebench Scores but have a slight Single-Core disadvantage, meaning they might not be as snappy in an active working environment.
Of course, we are talking HEDT here, this will only be noticeable in fairly complex use cases and 3D-Scenes.
Head over to “Best Computer for Cinema 4D” and “Best Hardware for GPU Rendering” for more in-depth insight into these highly interesting topics.
As there are so many different Processors available and being updated constantly, if I missed any that you are interested in, let me know and I’ll add them to the list!
Cinema 4D Benchmark
As Cinebench R15 is based on the Cinema 4D CPU Render Engine, it is, of course, a great way of benchmarking Cinema 4D on your Hardware, if this is a Software that you use or are planning on using.
Cinema 4D is very similarly structured like many other 3D-Software such as 3DS Max, Blender, or Maya, as it relies heavily on similar workflows and Hardware usage.
Cinebench in itself is often used as a Benchmark for benching all kinds of 3D Render Software and therefore the go-to Benchmark in this field of work.
Cinebench interesting picks
Let’s take a look at some of the most interesting CPUs in the Cinebench Scores.
AMD Ryzen Threadripper 2990WX: This CPU is an absolute Multi-Core Monster. Scoring over 5000 Cinebench Points, it easily takes the Cinebench Score lead.
It has 32 Cores and 64 Threads a base clock of 3,2 GHz with an all-core precision boost of 3,4 GHz and a precision boost overdrive on a single core up to 4,2 GHz.
This CPU is the top pick for Multi-Core optimized workloads, especially if it is utilized as a dedicated render node.
CPU Rendering, Encoding, anything that takes full advantage of extreme Core Counts. This highest Cinebench Score has a 1500 Point lead to Intel’s highest-scoring Cinebench CPU, the i9 7980XE which is even more expensive.
AMD Ryzen 2700X: With 8 Cores, 16 Threads, and a precision boost of up to 4,3 GHz, this CPU is great for Gaming, good for Rendering, and good for active Work in all kinds of Computer Graphics and 3D Softwares.
It trades blows with the i7 8700K, though is a lot cheaper and has a much higher performance per dollar ratio.
Intel i7 8700K & 8086K: The i7 8700K is an extremely popular gaming and high-core clock optimized CPU, great for active work in 3D Applications with excellent Viewport snappiness. Gaming workloads are usually unmatched by this i7 unlocked CPU.
The 8086K is an anniversary edition CPU that is essentially a well binned, overclocked 8700k. Expect this one to become rather hot in demanding workloads.
Intel i9 7980XE: Intel’s currently leading Cinebench Score CPU has 18 Cores and 36 Threads that clock at only 2,6 GHz base and turbo boost up to 4,32GHz on select cores.
It is great for Multi-Core workloads, though at the moment would be the second pick compared to AMD Threadripper CPUs, which are unbeatable in terms of performance/dollar.
Where are Cinebench Scores Saved?
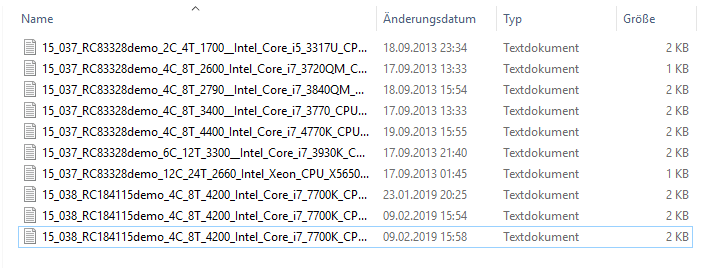
Depending on where you installed Cinebench (usually C:Program FilesMAXON) you will find a folder called cb_ranking inside.
Inside this folder there are multiple .txt Files, each one standing for a Score:
How to manually change, trick, or fake Cinebench Scores
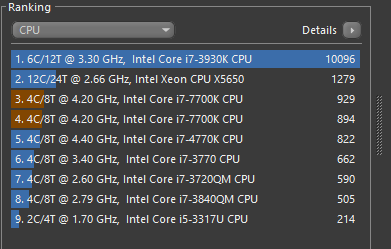
Faking Cinebench Scores is quite easy. Each Score is saved in an individual .txt File, which you can edit. Go to your Cinebench Installation Folder and open the subfolder cb_scores. Here you can open the .txt Scores File that you want to edit change as many Lines as you want. Some interesting Lines are the following:
- CBCPU1=148.396024 <- Cinebench Single Score
- CBCPUX=1096.371012 <- Cinebench Multi Score
Make the changes and save the file. The Next time you open Cinebench, the new Scores will be represented. I changed the Multi-Core Score of an i7-3930K CPU to 10096 points:
Why no Cinebench GPU Scores?
Cinebench R15 does have an OpenGL Benchmarking option. This Feature though unfortunately is so old, that the resulting scores are all over the place.
It was supposed to test the OpenGL capability of your Graphics Card, but almost any GPU nowadays is just too fast, making other components such as the CPU bottleneck and influence this Benchmark too much. In its newest version, the Cinebench R20 Benchmark, Maxon has already removed this feature.
There is a new Viewport Performance Benchmark for Cinema 4D here, which does an excellent job at measuring the snappiness of your active work.
Custom PC-Builder Tool
Ready to configure a great PC with high Cinebench Scores?
Head on over to the CGDirector Custom PC-Builder Tool that lets you configure your Computer at custom price points for all kinds of purposes. It suggests parts, that work best together and get the maximum performance out of your budget.

What Processor are you thinking of buying?
")

")
![Cinebench 2024 Scores [CPU & GPU] (Updated Results)](https://www.cgdirector.com/wp-content/uploads/media/2023/09/Cinebench-2024-Scores-Results-Updated-594x335.jpg "Cinebench 2024 Scores [CPU & GPU] (Updated Results)")

59 Comments
10 June, 2022
(Laptop : Dell inspiron 1501 / specs : AMD turion x64 2.0 ghz – 4GB Ram ddr800 Dual / 128MB VGA ATI Xpress 1100 )
cinebench r15 score: 37
cinebench r20 score : 75
cinebench r23 score : 162
19 June, 2021
Intel Xeon E5450 Stock @2993ghz
4 cores,4 Threads
Multi-core 330 pts
Single Core 85 pts
6 March, 2021
Intel Xeon E5 2673 V3
3.1 GHz
12 cores
Multi-core 1848 pts
Single core 126 pts